Note: You must be logged in via analytics.inspirenw.com to use this functionality (look for your initials in the upper right corner).
Table of Contents
- Show Me Please! (video demonstrations)
Filtering
Reports can be filtered to provide different views of available data (including metrics like graphs or single values).
Filtering a Graph
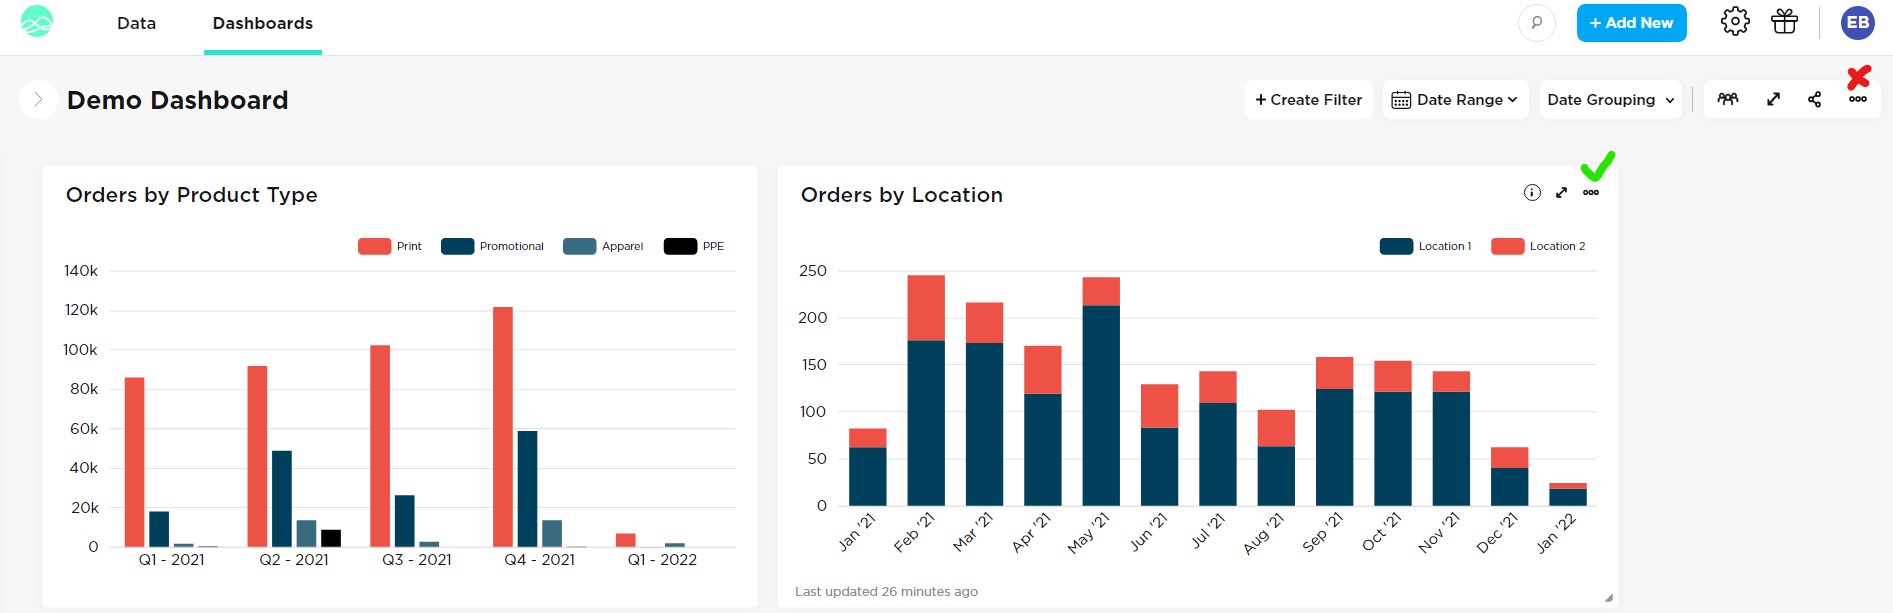
- To filter a graph, click on it. It will open in a larger window.
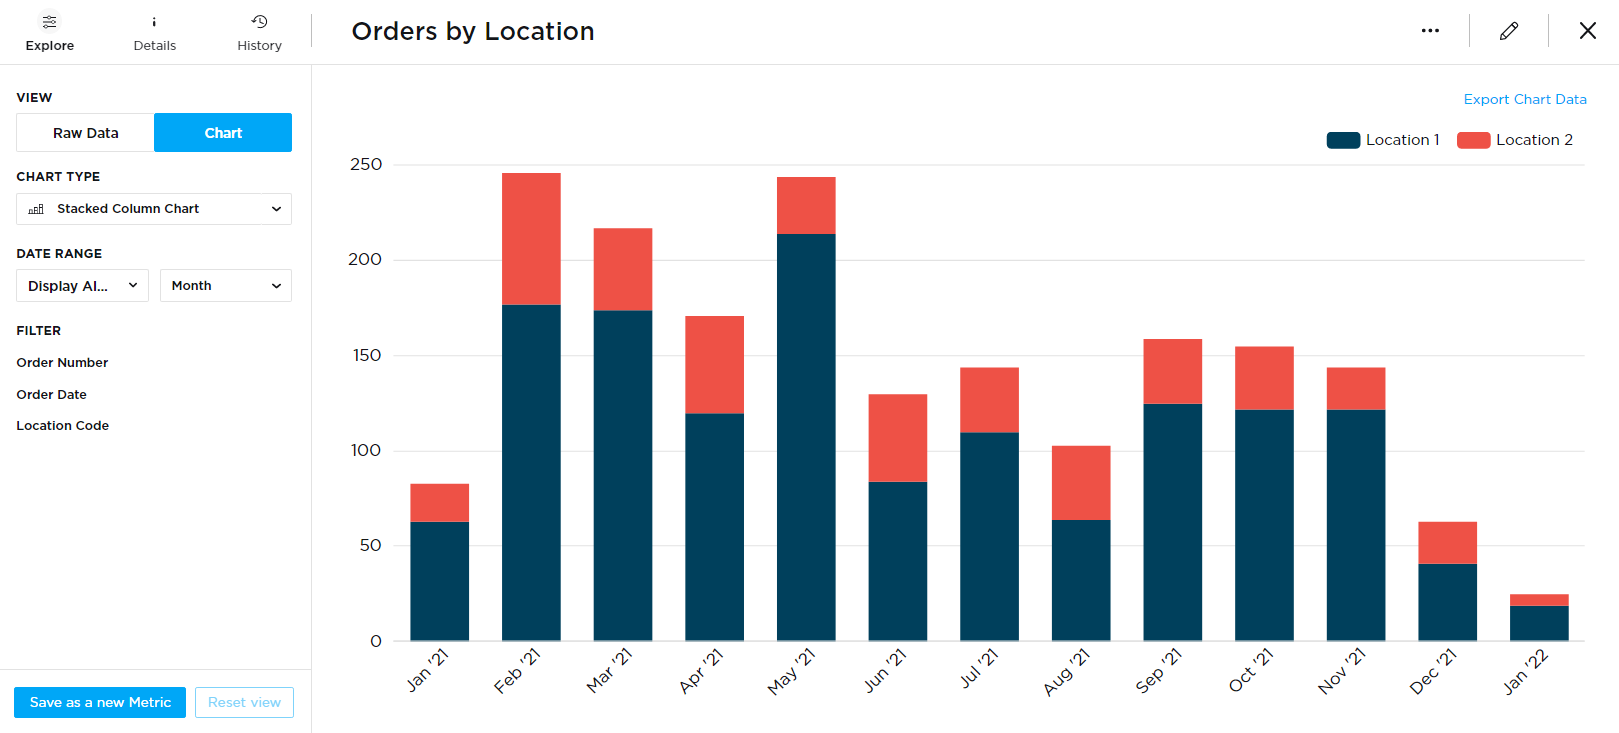
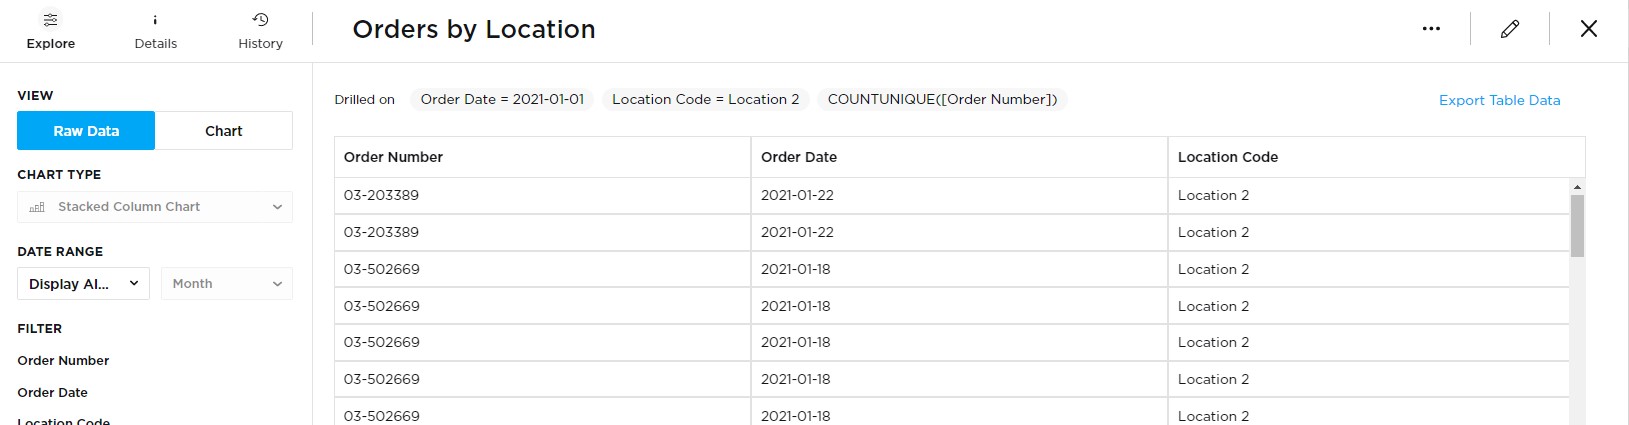
- You can click on the graph to drill in to more detail. For example, clicking the red section on the first bar will show the orders placed by Location 2 in Jan '21.
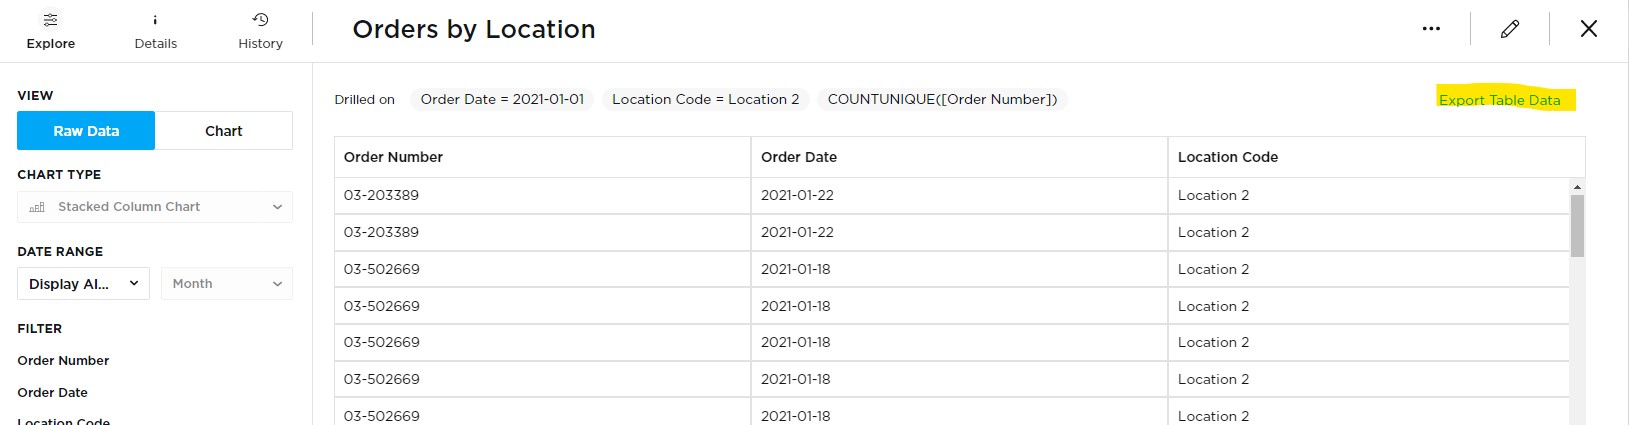
- You can export the data at any time by clicking the link "Export Table Data"
Filtering a Table
- Tables are opened by hovering over the metric - click the arrows that appear in the header.
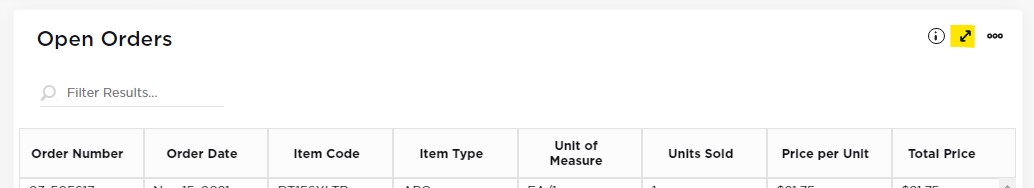
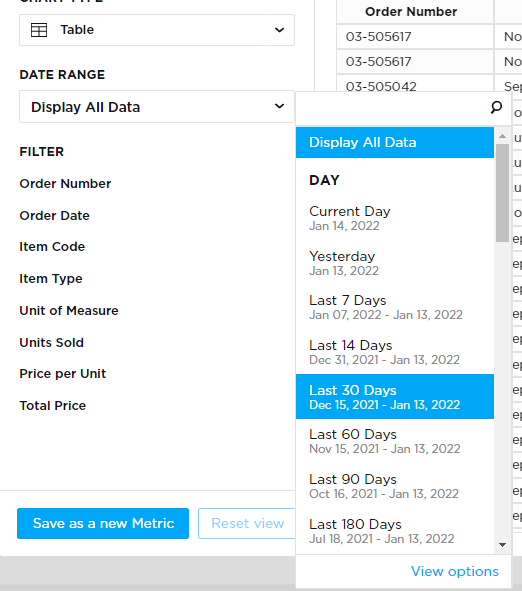
- Filters are available from the left sidebar. You can change the date range by selecting an option from the drop down.
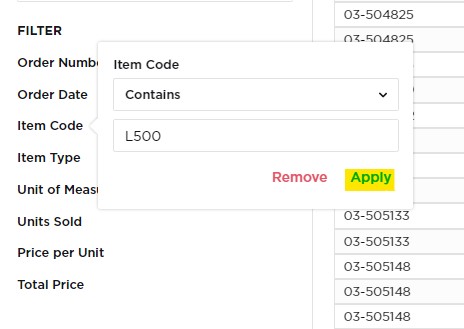
- You can also filter by making selections from the items shown under "FILTER". For example, you could filter the list of open orders to only show items with "L500" in the item code.
-
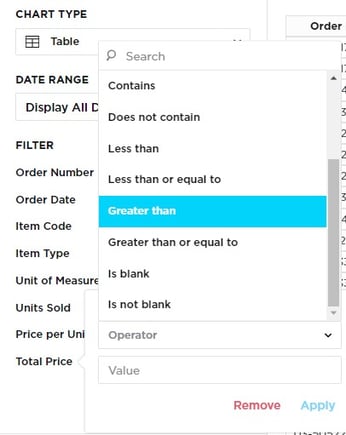
Here is a closer look at using the filters:
Example: Only show orders with a total price over $1000
Example: Only show orders with a total price over $1000
- Click Total Price on the left sidebar
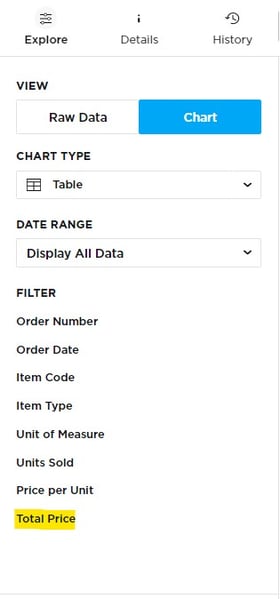
- Choose an operator. In this example, we will use greater than
- Enter a value. In this example, 1000 (don't add the $)
- Click Apply
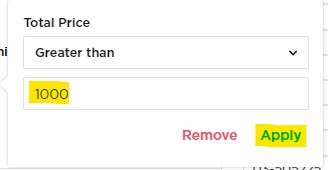
- You're all done! The report will now show orders with a total price over $1000
Metric Filtering in Action
Filtering a Graph with Export
Filtering a Table with Export
Exporting
Dashboard Exporting
An entire dashboard can be exported into PDF format.
- In the upper right, click the three dots.

- Click "Generate PDF"
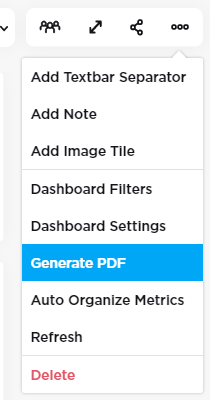
You will receive a email containing the PDF export.
Dashboard Exporting in Action
Metric Exporting
A metric (including graphs) can be quickly exported from the main dashboard.
- Hover over a metric you would like to export until you see three white dots.
Note: These are not the same three dots that are always visible in the upper right of the dashboard
- Click the three dots and select "Export Raw Data"
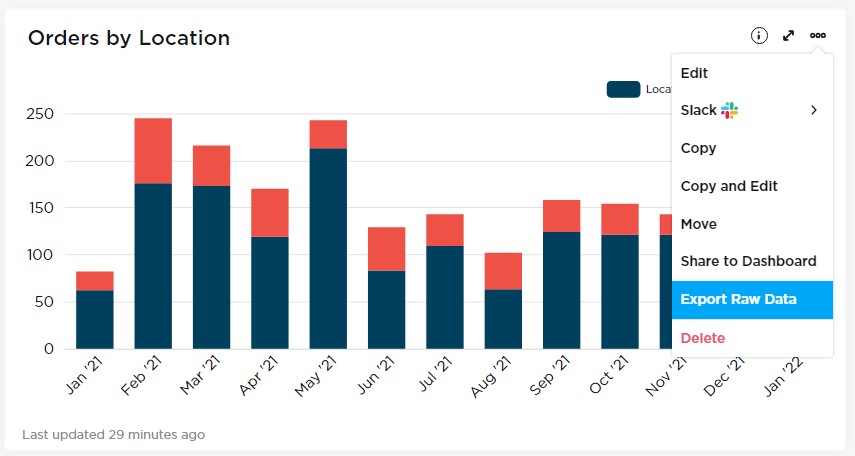
You will receive an email containing the report (in CSV format) 
Return to Top
Metric Export in Action